Brief Summary on Creating Accessible Documents for People who are Blind
Published onOne of the most important things when creating accessible documents in braille, audio, large print, or accessible PDF is authoring content that doesn’t rely heavily on visual elements. Photographs, complex tables, charts, or other components that can’t be adequately described in the text should be avoided or reconsidered.
Image content is okay for a sighted reader but brings no value to the braille reader or someone listening to an audio document. With that in mind, we suggest you create your original draft as usual. Then, as an exercise, review your document. Wherever you find an image or a table, try to replace the visual component with a text description. When writing text to describe pictures, use the original Twitter rule, and try to limit yourself to 140 characters or less. It’s okay if you go over but you don’t want to have 12 paragraphs of descriptive text for a single image.
If you can’t adequately describe the visual component, you should consider using a different visual element, or write paragraph text into the original document that provides the same information.
Color Contrast
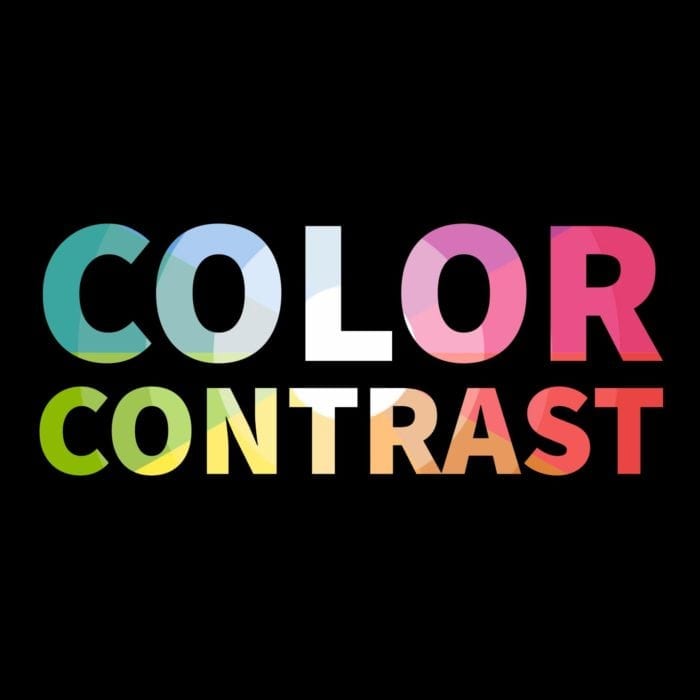
For logos, font colors, and other stylistic aspects, make sure the contrast ratio is adequate for someone with low vision. For example, well-intentioned marketing departments and graphic designers often use a light blue shape with a white text overlay. They’re trying to achieve an “airy” feel, but they create text that many people cannot read.
- The standard for contrast ratio is 4.5:1 for normal text and 3:1 for large text.
Software tools and Adobe plugins can help you choose colors that provide enough contrast for people with a visual impairment.
Fonts
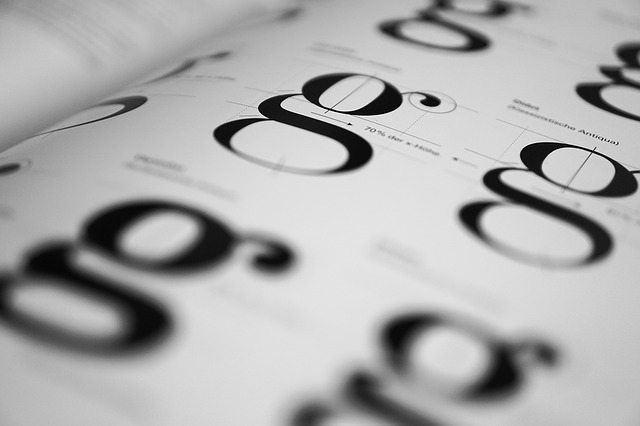
There are several recommendations related specifically to fonts. Basic fonts like Verdana, Arial, Tahoma, and Calibri are the best for accessibility. Thankfully, these fonts are defaults on most computers and word processors. Avoid decorative fonts and serif fonts when possible. Instead, consider using bold type to highlight important information because the heavier font makes the print more legible; and finally, steer away from italics, a script that looks cursive, or all capital letters. These styles make it difficult to differentiate the letters.
Tables and Charts
Tables and charts are complex because authors often use colors to differentiate between data and time (i.e., bar graph, pie chart). Using color as the sole method of conveying information violates the “Use of Color” guideline. (1.4.1). This issue can be solved in multiple ways. Add text labels to your charts, using patterns or symbols instead of color. Or include the data seen in the graphs/charts in a table to help make your document more accessible and more compliant.
If you’re going to clean up a table to prepare it for Section 508 remediation, make the table as simple as possible. First, we suggest adding gridlines around cells with information. Next, remove merged cells. Merging cells allows you to take several cells and make it one single cell to align or center across rows or columns. However, a sighted reader uses merging cells to better understand the information displayed. This is a visual aid that doesn’t work well with screen reader technology. Not to mention, merged cells are notorious for creating issues when users try to sort or move data and when trying to navigate in assistive technology software. At the very least, your tables will require column headers – some tables will have row headers, as well.
Technical Talk for Tables
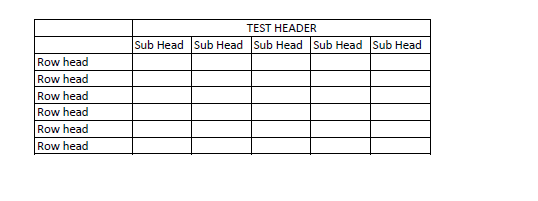
If you use merged cells to group a set of columns under a single header that’s helpful. Consider it like Step 1. A merged header does help organize the content, but when we remediate a table we do some work behind the scenes to make it more accessible/compliant. When files have merged cells, visually, it looks the same, but we add invisible text behind the scenes so we can properly tag the table.
For example, we add invisible text to the large “Test Header” section and each “Sub Head” section for assistive technology to read in order (see the figure below). That’s because the assistive device still tabs through each cell that you don’t see on the visual level, and doesn’t always know in what order.
Last, if your table is large and runs on more than one page, merge the table. That may seem like conflicting information but merging cells and merging tables are different. Merging the table means your table will read in its entirety without interruption by the extra column headers. The column headers will only read once at the very top of the table and not break up the data by rereading the column header on every page that it appears.
There are ways to “linearize” the content for a person with visual impairment or blindness for tables and charts. That’s where Braille Works’ expertise comes in. We can create the textual content that will organize the information so the reader or listener can consume it.
PDFs
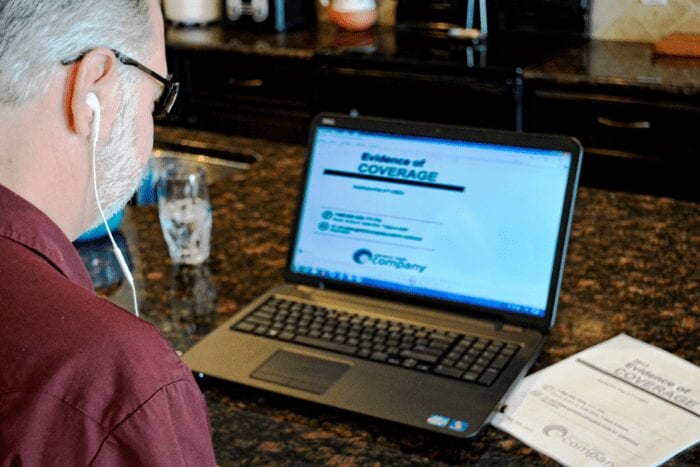
Lastly; when you create a PDF version of the document, make sure it’s Section 508 compliant. That way everyone who downloads the document can read it in the correct order, with images properly described. Have the document remediated so the person using assistive technology can read the document in the correct reading order; properly navigate the document; and that all links, table properties, and other components are easy to read and understand.
Creating Accessible Documents will Remain a Priority
We applaud the effort to create documents for everyone! There are approximately 12 million people in the United States with a visual impairment or blindness. Add to that number the fact that here in the U.S., 10,000 people turn age 65 every day; 7 days a week; 365 days a year. Even more striking is that virtually everyone over 45 experiences some form of age-related vision loss. Vision losses that make reading small print and distinguishing colors difficult. It’s one of the fastest-growing market segments and they control a significant number of resources. By creating accessible documents like, you’re tapping into a substantial and widely overlooked market.
Categorized in: Accessibility, Informational
This post was written by




Comments are closed here.